 Malcolm Keith 2026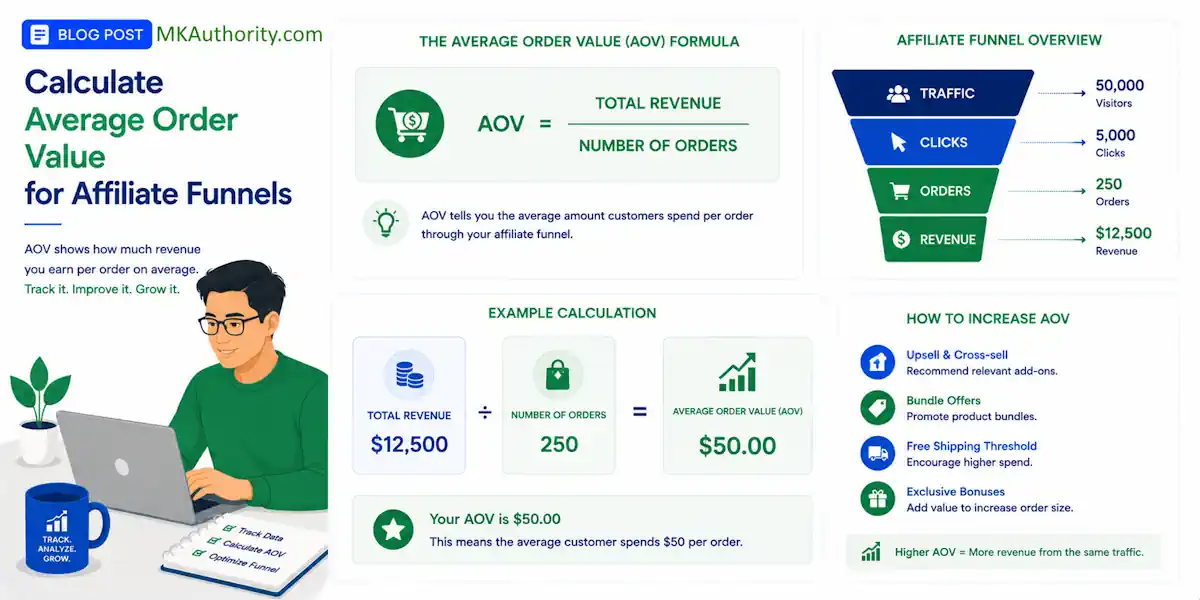

A funnel can look profitable and still lose you money. That is what happens when you focus on clicks and conversion rate, but don’t calculate average order value – AOV.
Average order value (AOV) measures the average amount spent per transaction. A simple formula is the Total Revenue / Total Number of Orders over a specific timeframe.
If you are buying traffic, running presells, or stacking offers, you need to know what each buyer is worth on average. Once you know how to calculate average order value the right way, your commission forecasts get cleaner, your ad budget gets smarter, and weak spots in the funnel show up fast.
Mastering this metric is essential for any effective marketing strategy.
Let us make it simple and practical.
Key Takeaways
- Average order value is determined by dividing total revenue by the number of orders, but affiliates often need to estimate this metric differently than merchants do.
- In affiliate funnels, average order value can include the front-end offer, order bumps, upsells, and even later offers, depending on your tracking and payout terms.
- Merchant-reported data is typically cleaner, but calculating your own average order value is what helps you make daily traffic and scaling decisions.
- Presell pages can improve buyer quality, but they also add attribution gaps if your tracking setup is loose.
- Average order value matters because it changes what you can afford to pay for clicks, leads, and customers.
What average order value means inside an affiliate funnel
Average order value, or AOV, is one of the most critical ecommerce metrics for measuring the performance of an affiliate funnel. It represents the average amount spent per completed order. To find this number, you use the standard AOV formula:
AOV = Total revenue / Total number of orders

For example, if a funnel generates $5,000 in total revenue from 100 total number of orders, the average order value is $50.
While this math is straightforward, it can be more complex for affiliates. A merchant typically views the full cart value inside platforms like Shopify, ClickBank, or Digistore24, but you often lack that full visibility. This creates a split between merchant-reported AOV and affiliate-estimated AOV.
Merchant-reported AOV reflects the real data from completed transactions, accounting for the main product, order bumps, one-click upsells, downsells, and recurring add-ons. Affiliate-estimated AOV, however, is the best working number you can derive from the data available to you, such as network EPC, personal conversion tracking, or payout reports.
These figures help you better understand customer spending patterns even when you cannot see the entire checkout process.
If you promote offers with a single flat payout, you might think average order value does not matter. It still does. A higher cart value often indicates that the merchant has more room to pay strong commissions, sustain a higher EPC, and convert better-quality traffic over time.
HostPapa’s AOV overview provides a solid basic refresher if you want an additional look at the definition.
For affiliate marketers, AOV is not just a store metric. It is a vital traffic metric and a scaling metric. Tracking it is one of the fastest ways to determine whether your funnel economics make sense.
How to calculate average order value when you’re the affiliate, not the merchant
Now let’s get into the part that matters. How do you calculate average order value when you do not control the checkout process?
Start with the cleanest number possible
If the merchant or network dashboard provides the total sales value and total orders, use that data first. This is the most reliable way to determine your performance metrics. If you have integrated Google Analytics with your funnel tracking, cross-referencing this data can help ensure your reporting is accurate.
AOV formula: Merchant-reported AOV = Total funnel revenue / Total orders
Example:
| Metric | Value |
|---|---|
| Front-end sales | $2,400 |
| Order bump sales | $600 |
| Upsell sales | $1,500 |
| Total revenue | $4,500 |
| Total orders | 75 |
| AOV | $60 |
In this table, the total revenue is $4,500 based on 75 orders. In this case, the AOV is $60. That number is gold because it tells you what a buyer spends on average across the whole funnel, rather than just the initial offer.
Use an affiliate-estimated version when full revenue is hidden
Often, you only have access to your commission data. In these cases, you can reverse engineer your results to find the total revenue.
AOV formula: Estimated AOV = Total commissions earned / Average commission rate
Then, divide that figure by the number of attributed orders to arrive at your estimate.
Example:
| Metric | Value |
|---|---|
| Commissions earned | $1,200 |
| Average commission rate | 40% |
| Estimated total revenue | $3,000 |
| Attributed orders | 50 |
| Estimated AOV | $60 |
This works best if the commission rate is steady. If the front end pays 50%, the upsell pays 30%, and a continuity offer pays a flat amount, the estimate becomes less precise. It is still useful for high-level planning, even if it is not perfect.
If you cannot get the exact AOV, get a usable estimate. Media buying decisions regarding your customer acquisition cost and return on ad spend simply cannot wait for perfect data.
Another shortcut is calculating the revenue per customer from your own specific traffic segment:
AOV formula: Estimated AOV from your traffic = Total attributed revenue / Total buyers from your traffic
If the network shows 32 sales and $1,920 in affiliate-attributed revenue, your estimated AOV is $60. This is not the merchant’s global AOV, but rather your traffic-specific AOV, which is often more useful for optimizing your campaigns.
When your numbers start looking messy, it helps to tighten your setup with a beginner guide to affiliate conversion tracking. Clean tracking makes every AOV estimate better, allowing you to manage your budgets with confidence.
Worked examples to calculate average order value with bumps, upsells, and multi-offer paths
This is where many people get tripped up. They calculate the front-end product only and think they are done. They are not.
Example 1: Front-end offer only
Let’s say you send 1,000 clicks to a direct offer.
- 40 people buy a $27 product
- No cross-selling
- No upselling
Revenue is $1,080.
The average order value is $1,080 / 40 = $27.
Simple enough.
Example 2: Add an order bump
Now the same funnel uses cross-selling with a $17 order bump.
- 40 people buy the $27 offer = $1,080
- 12 buyers take the $17 bump = $204
Total revenue is $1,284.
The average order value is $1,284 / 40 = $32.10.
Notice what happened. The conversion count did not change. The average order value went up because some buyers chose to spend more.
Example 3: Add a one-click upsell
Now add a $47 one-click upsell after checkout to improve your funnel performance.
- Front end: 40 x $27 = $1,080
- Bump: 12 x $17 = $204
- Upsell: 8 x $47 = $376
Total revenue is $1,660.
The average order value is $1,660 / 40 = $41.50.
That is a big difference. With the same 40 customers, you are generating much more value per order.
Example 4: Multi-offer affiliate funnel with a presell page
Now picture a common affiliate setup. You run ads to a presell page, then send people to Offer A. Buyers later see Offer B and Offer C inside the merchant funnel, often utilizing product bundling as a core pricing strategy to maximize total cart value.
- 2,000 ad clicks
- 500 land on the merchant page after your presell
- 25 buy Offer A at $37 = $925
- 10 add a $27 bump = $270
- 6 take a $77 upsell = $462
- 3 take a $97 backend offer = $291
Total revenue is $1,948.
The average order value is $1,948 / 25 = $77.92.
That number changes how you think about the funnel. The front-end product looks small at $37. However, the real value is closer to $78.
If you are paid 50% across the funnel, your expected commission per order is about $38.96. That is the kind of number that can turn a mediocre campaign into a scalable one.
For ideas on improving the cart value side of the equation, Digistore24’s AOV tips are worth a quick look.
Presell pages, attribution gaps, and why your AOV estimate may be lower than reality
Presell pages are highly effective when used correctly. They warm up cold traffic, frame the offer, answer common objections, and filter out low-intent clicks. This process typically improves your conversion rate and leads to a higher quality of buyer.
However, there is a catch.
Every extra step between an ad click and the final checkout introduces tracking risk. Parameters can be stripped, cookies may expire, and users often switch devices between initial clicks and final purchases.
Furthermore, some networks only credit the initial offer rather than the entire upsell path, which impacts your reported order volume. This is why the average order value reported by the merchant and the amount estimated by the affiliate often do not match.
Here are the common trouble spots:
- Your presell page link drops sub IDs or click IDs.
- A redirect tool strips essential UTM parameters.
- The merchant records upsells, but the affiliate platform only credits the initial sale.
- A customer returns to the site later and completes a purchase without your original attribution cookie.
- Platform reporting windows do not align with your ad platform windows.
So what should you do? Keep it practical.
Use unique tracking IDs for every traffic source, ad angle, and presell variant.
Check whether the network passes conversion data back by click ID, placement ID, or sub ID.
If you are running paid traffic, use solid affiliate marketing link tracking tools so you can compare clicks, opt-ins, hops, and sales in one centralized location.

Also, separate these three numbers in your reporting:
- Observed average order value, based on what the network shows you.
- Estimated full-funnel average order value, based on known upsell behavior.
- Paid average order value, based on the revenue you actually receive commissions on.
These three metrics are not always the same. That discrepancy is normal. The goal is to identify which specific metric you are using before you attempt to scale.
Publitas’ take on increasing AOV with affiliate traffic also highlights something performance marketers already know: traffic quality directly affects your total order volume and the final cart value.
How AOV shapes commission forecasts, traffic budgets, and funnel decisions
Once you have a reliable average order value, your broader marketing strategy becomes much clearer. Understanding this metric allows you to project customer lifetime value more accurately, helping you decide which funnels warrant a higher budget.
Merchants often try to increase average order value through tactics like loyalty programs or by setting specific free shipping thresholds, and you should factor these efforts into your own projections.
First, you can forecast commissions faster.
Use this formula:
Expected commission per order = Average order value x commission rate
If your average order value is $78 and your average commission rate is 50%, you earn about $39 per customer.
Next, tie that to conversion rate.
Expected revenue per click = Conversion rate x commission per order
If your offer converts at 2% and expected commission per order is $39:
0.02 x $39 = $0.78 EPC
Now you have a rough top-end click target. If your traffic costs $0.45 per click, you may have room. If it costs $1.10, you are probably upside down unless lead value or recurring revenue fills the gap.
This also helps with traffic budgeting.
A funnel with a lower average order value usually needs cheap traffic, stronger conversion rates, or backend monetization to be profitable. A funnel with a higher average order value can often tolerate more expensive clicks, broader targeting, and more testing.
AOV also points to what to optimize first.
If clicks are cheap but profit is weak, maybe the front-end conversion rate is fine and the real issue is poor bump uptake.
Maybe the upsell take rate is strong but the presell page kills click-through, fix the bridge page before touching the offer.
If merchant-reported data is strong and your paid results are low, attribution is the problem.
Average order value tells you whether to buy more traffic, fix the funnel, or question the tracking.
That is why serious affiliates do not look at conversion rate alone. A 1.5% conversion on a $120 order value funnel can beat a 4% conversion on a $25 funnel all day long.
Frequently Asked Questions
Why does the average order value I calculate differ from the merchant’s reports?
Your estimated AOV often differs from the merchant’s data due to attribution gaps, such as tracking cookie expiration, redirected UTM parameters, or platforms that only credit the front-end sale rather than the full upsell path. It is common for these numbers to vary, so focus on using consistent, traffic-specific data to make your scaling decisions.
How does AOV change my daily traffic buying strategy?
Understanding your AOV allows you to calculate your target revenue per click, which directly dictates how much you can afford to bid for ad traffic. A higher AOV gives you the flexibility to pay for more expensive, higher-quality traffic, while a lower AOV usually requires you to optimize for lower acquisition costs to remain profitable.
Should I include recurring revenue in my average order value calculation?
It depends on whether you want a snapshot of immediate funnel performance or a projection of long-term customer value. For daily ad spend and immediate funnel optimization, it is best to track the initial funnel-based AOV, while treating recurring commissions as an additional layer of lifetime value for your broader strategy.
Conclusion
If you want to make cleaner funnel decisions, you must learn to calculate average order value using the data you actually have, rather than the numbers you wish you had. Start by pulling merchant data when it is available, then build a reliable affiliate estimate that accounts for order bumps, upsells, and credited backend sales.
The more accurate your average order value becomes, the more precise your forecasts, traffic caps, and optimization decisions will be. When a funnel finally starts to scale, this metric evolves from a simple spreadsheet entry into a vital guardrail.
By maintaining a disciplined approach to calculate average order value and also tracking your average order value, you ensure that your business remains profitable and protected as you grow.