 Malcolm Keith 2026
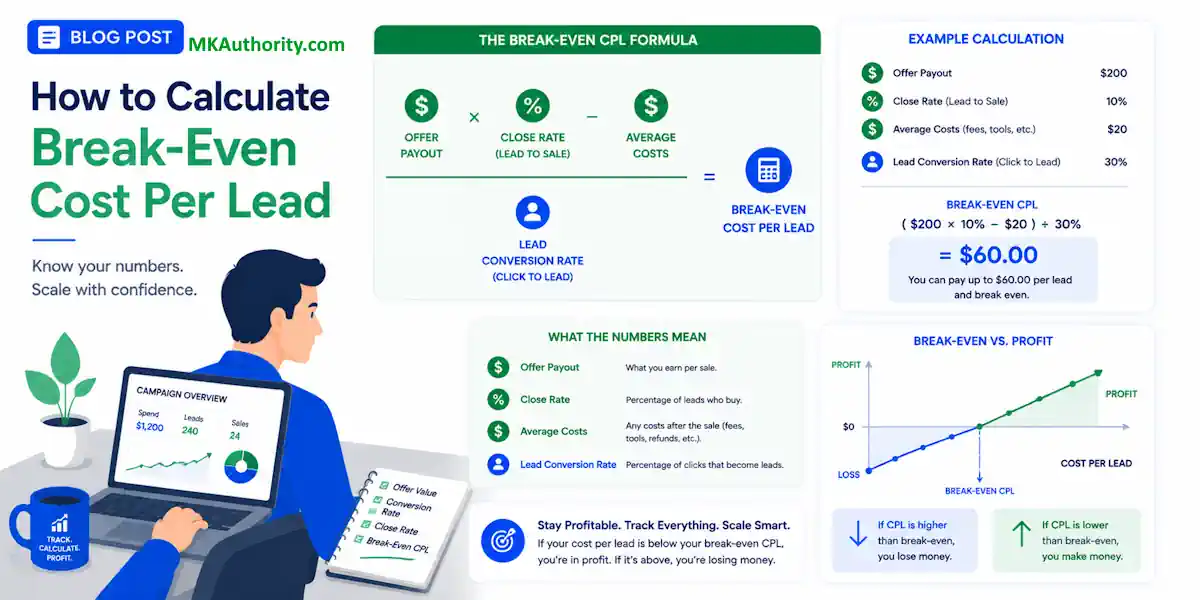
What is the maximum amount you can afford to pay for a new prospect before your campaign stops being profitable? That is the question behind your break-even cost per lead, and it is a calculation every marketer, agency owner, and business operator must perform before spending another dollar.
If you skip this calculation, your lead generation costs can look manageable right up until your profit margins disappear. Without understanding your total marketing spend in relation to your revenue, you risk burning through your budget without a clear way to measure success.
Cost Per Lead (CPL) is a metric that measures how much you pay to acquire a single potential customer. Calculated as Total Marketing Spend over Total LeadsGenerated, it helps businesses determine which marketing campaigns offer the best return on investment.
Getting this number right gives you a firm benchmark for your sales funnel, paid traffic, affiliate offers, and list building campaigns. By establishing an accurate cost per lead, you gain the confidence to scale your acquisition efforts effectively.
Let’s get the formula on the table first, then walk through the math.
Key Takeaways On Calculating Break-Even Cost Per Lead
- Define your limit: Your break-even cost per lead (CPL) is the maximum amount you can spend to acquire a prospect without losing money, calculated by multiplying gross profit per sale by your lead-to-sale conversion rate.
- Use profit, not revenue: Always base your calculations on gross profit—subtracting variable costs like fulfillment and commissions—rather than top-line revenue to ensure your marketing spend remains sustainable.
- Segment by channel: Lead quality varies significantly across sources like Google Ads, social media, and email; calculate your break-even point separately for each channel to identify which platforms are actually driving profitable results.
- Plan for a buffer: Your break-even number is your “red line.” To ensure true profitability, your target CPL should always sit below this threshold to account for business overhead, market volatility, and margin errors.
The formula that sets your lead ceiling
Your break-even cost per lead is the most you can pay for one lead without losing money on that source. By identifying this number, you find your break-even point, which marks the exact transition from losing money to generating a profit.
Here is the simple version:
Break-even cost per lead = Gross profit per sale x Conversion rate
You can also expand it like this:

Max cost per lead = Average sale price x Gross margin % x Conversion rate
That formula works because not every lead becomes a buyer. A lead is only worth the profit you make from a sale, adjusted by the odds that the lead converts.
A lead isn’t worth your full sale price. It’s worth the gross profit from a sale, multiplied by the chance of closing it.
A quick example makes this click. If your average gross profit per sale is $200 and 10% of leads buy, your break-even cost per lead is $20.
- Pay $20 per lead and you break even.
- Pay less and you have room for profit.
- Pay more and you are upside down.
This is basic break-even logic applied to your marketing spend. If you want a broader refresher on break-even analysis itself, Investopedia’s overview of break-even analysis lays out the core idea well.
One warning matters here. Use gross profit, not revenue. If you sell a $500 product but only keep $150 after direct costs, commissions, and fulfillment, your lead value is based on $150, not $500.
Gather these inputs before you run the numbers
You don’t need a finance degree for this. You do need the right inputs to accurately determine your lead generation costs.
Before you calculate, pull these numbers:
- Your average sale price
- Your gross margin percentage, after accounting for both variable costs and fixed costs
- Your average gross profit per sale
- Your lead-to-sale conversion rate for qualified leads
- Channel-specific close rates, if your target audience behaves differently across sources
- Refund, chargeback, or churn rates, if they materially affect profit
- Any direct variable costs tied to each sale, such as commissions or onboarding costs
Whether you are focusing on landing page optimization, paid ads, or an overall lead generation strategy, the formula remains the same. Only the inputs change.
Most businesses already have these numbers somewhere.
- Your store or CRM shows average order value.
- Your bookkeeping gives margin.
- Your funnel or CRM shows how many members of your target audience became customers.
If you build a list first, then sell later, your email marketing and list building blueprint can affect close rates more than people think.
Don’t guess if you can avoid it. Even rough historical data regarding lead quality beats hope.
A simple break-even cost per lead example
Let’s use a clean, easy example first to determine your maximum allowable cost per lead.
Say you sell a $100 digital product. Your delivery cost is low, so your gross margin is 80%. That means your gross profit per sale is:
$100 x 0.80 = $80
Now, assume you are generating qualified leads and 1 out of 8 becomes a customer. Your lead-to-sale conversion rate is:
1 / 8 = 12.5%
Now plug both numbers into the formula to find your target cost per lead:
$80 x 12.5% = $10
Your break-even cost per lead is $10.
Here is what that means in plain English:
- If you pay $6 per lead, you are well under your break-even point and should see a positive return on investment.
- If you pay $10 per lead, you are flat before overhead.
- If you pay $14 per lead, the campaign loses money.
That is the whole point of the metric. It gives you a ceiling for your acquisition spending.
You can also reverse check the same math. If eight leads cost you $80 total, and one sale from those eight leads creates $80 in gross profit, you break even. Same result.
This is why a campaign can have a decent click through rate and still fail. If your conversion rate is low or your cost per lead is too high for the profit behind them, the sales funnel simply will not work.
A more realistic break-even cost per lead example with different traffic channels
Now let us use numbers closer to what an agency, coach, or higher-ticket affiliate offer might see.
Assume your average sale is $2,500. Direct fulfillment, sales commission, and delivery costs add up to $1,400. Your gross profit per sale is $1,100.
That part is easy.
The next part is where most people miss it.
Your close rate varies depending on whether you are working with marketing qualified leads or sales qualified leads. Furthermore, your ad spend will likely yield different results because lead quality fluctuates significantly between platforms.
This comparison shows why channel-by-channel math matters:
| Channel | Lead-to-sale rate | Break-even CPL | Actual CPL |
|---|---|---|---|
| Google Ads | 9% | $99 | $78 |
| Facebook Lead Form | 4% | $44 | $57 |
| LinkedIn Ads | 7% | $77 | $85 |
| Warm Email List | 14% | $154 | $21 |
The takeaway is clear:
Google Ads leads are profitable.
Facebook and LinkedIn leads are not, at least with this specific funnel, because the high ad spend does not justify the lower conversion rate.
Warm email leads are wildly profitable because the close rate is higher and the acquisition cost is low.
When comparing these channels, remember that lead quality is rarely uniform. A cold social lead lacks the same intent as a buyer searching for your service. By focusing on generating more qualified leads, you can improve your margins significantly.
That last row is why owned audiences matter. If you can lower paid acquisition pressure with better opt-ins, referral loops, or using viral lead magnets for growth, your blended CPL can improve fast.
If you want another plain-language view of CPL math, Leadfeeder’s cost per lead guide shows the same relationship from a campaign angle.
One more point. Don’t blend all your leads together unless they truly behave the same way. A cold social lead and a buyer-intent search lead are not the same asset, and your analysis should reflect those differences in lead quality.
How to adjust the formula for recurring revenue, uneven margins, and channel close rates
The basic formula does not change. What changes is how you estimate profit and conversion to find your target acquisition costs.
For recurring revenue businesses
If you operate a B2B SaaS company or a subscription-based model, you should calculate the customer lifetime value to determine your true margins. Instead of focusing only on the initial transaction, use the expected gross profit over the entire customer lifetime. Calculating customer lifetime value accurately helps ensure your marketing remains sustainable.
Say you run a $49 per month membership in a B2B SaaS model. The average customer stays 8 months, and your gross margin is 80%. When you assess your customer lifetime value, your expected gross profit per customer is:
$49 x 8 x 0.80 = $313.60
If 10% of leads become customers, your break-even CPL is:
$313.60 x 10% = $31.36
That is your lead ceiling. Remember to monitor your LTV CAC ratio as a key performance indicator to ensure your spending remains efficient. Keep these estimates conservative. If retention is shaky, use a lower lifetime value. If refunds hit hard in month one, account for them before you calculate your maximum customer acquisition cost.
For variable gross margins
Some businesses sell a mix of products with different margins. In that case, use a weighted average gross profit per sale based on your specific conversion rate.
Example:
- 60% of buyers purchase Product A, which produces $140 in gross profit
- 40% buy Product B, which produces $200 in gross profit
Your weighted average gross profit is:
(0.60 x $140) + (0.40 x $200) = $164
If your lead-to-sale conversion rate is 7%, then:
$164 x 7% = $11.48
That becomes your break-even cost per lead.
For different close rates by channel
This part is simple. Run the formula separately for each source.
Search traffic may close at 10%. Webinar leads may close at 18%. Cheap social leads may close at 2%. Although the offer is the same, the economics vary significantly based on the lead quality. When you separate channels, you stop treating every lead like it has the same value.
It does not, and calculating your break-even point by channel ensures you are not overpaying for low-intent traffic.
Common mistakes that wreck the calculation
Revenue is not profit. This is the biggest mistake, and it makes weak campaigns look healthy. If you use top-line sales instead of gross profit, your calculated customer acquisition cost will be inflated, which hides the true impact of your total marketing spend.
Ignoring lead-to-sale conversion rates causes the same problem. A lead is not a customer. If you stop the math at profit per sale, you fail to see that your customer acquisition cost may actually exceed your margins. Always compare your results against industry benchmarks to ensure your spending remains sustainable.
Blended averages can hide channel problems.
One high-performing source can cover up three bad ones. Break out paid search, social, affiliates, email, and referral traffic when close rates differ across your target audience. If a specific channel underperforms compared to industry benchmarks, you should investigate your landing page optimization to improve lead quality before committing more ad spend.
Short time windows can lie to you. Ten leads is not enough data for most businesses. Use a sample large enough to reflect normal performance. If your ad spend is volatile, you need a larger data set to determine if a dip is just a temporary variance or a structural issue.
Recurring revenue businesses often overstate lifetime value. If churn hits early, your lead value falls with it. The safer move is to use conservative retention numbers rather than aggressive projections that ignore industry benchmarks.
Another common miss is forgetting variable sales costs. Setter commissions, closer commissions, onboarding labor, and payment fees must be subtracted before calculating your true profit. Failing to account for these costs leads to an inaccurate customer acquisition cost, which inevitably inflates your total marketing spend.
Finally, do not confuse your break-even cost per lead with your target cost per lead. Your break-even point is the red line. Your target should usually sit below it, providing a necessary buffer for profit, overhead, and normal market volatility.
Frequently Asked Questions
Why should I calculate break-even cost per lead instead of just looking at ROI?
Calculating your break-even CPL provides a proactive spending ceiling rather than a retrospective analysis of success. By knowing your limit before you launch a campaign, you can prevent wasted budget and identify failing channels before they erode your total profit margins.
Can I use the same formula for recurring subscription services?
Yes, but you must adjust your inputs to reflect customer lifetime value rather than a single transaction. Calculate the total expected gross profit over the average customer lifespan and apply your conversion rate to that figure to determine an accurate target acquisition cost.
How many leads do I need to get an accurate conversion rate?
Avoid making decisions based on small data samples, as ten or twenty leads rarely represent your true funnel performance. Use a large enough sample size that accounts for normal fluctuations in traffic quality so your conversion rates are statistically significant before you adjust your strategy.
What should I do if my actual cost per lead is higher than my break-even point?
If your acquisition cost exceeds your break-even point, you are losing money on every lead. You must either optimize your landing page and sales process to increase your conversion rate, reduce your ad spend, or switch to lower-cost, higher-intent traffic sources to restore profitability.
Conclusion on calculating break-even cost per lead
Once you understand the math, lead buying becomes far less emotional. Your break-even cost per lead is simply the gross profit from a sale, adjusted by the likelihood that a lead becomes a customer.
That figure is your essential benchmark. By monitoring your cost per lead across different sources, you can refine your lead generation strategy to focus on the highest quality traffic. Keep your inputs honest and use conservative estimates for profit and conversion rates to ensure your return on investment remains positive.
When you evaluate your cost per lead with this level of precision, you stop guessing what a prospect is worth and start executing a lead generation strategy with your eyes wide open.