Malcolm Keith 2026
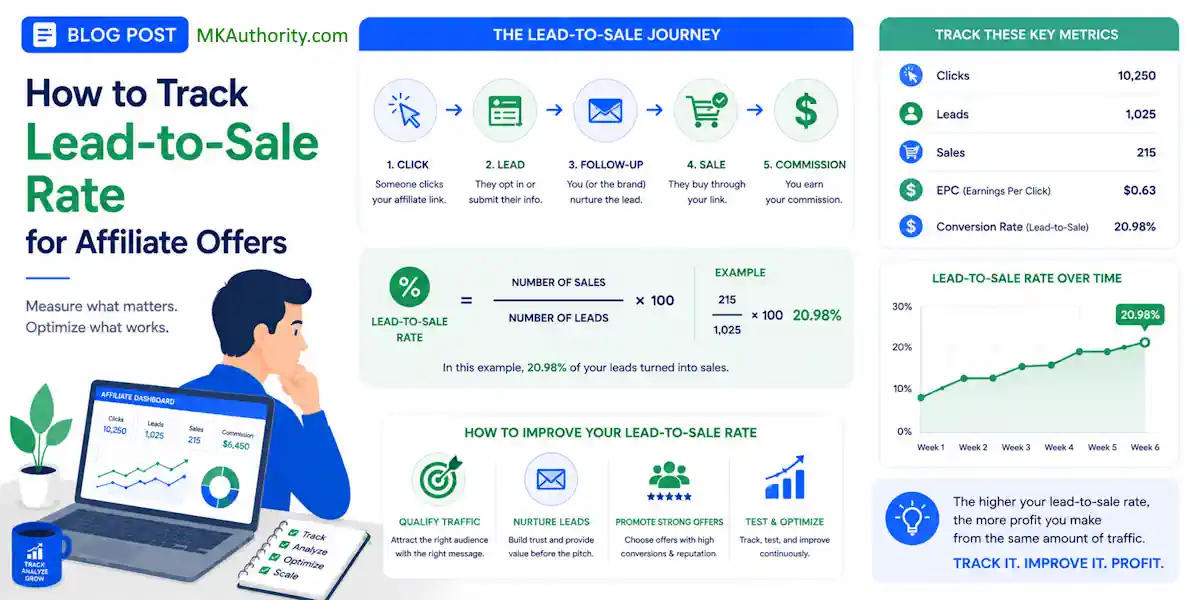
A lead is not revenue; it is just a possibility. The lead-to-sale rate is the percentage of leads that ultimately become paying customers and measures the overall effectiveness of your sales and marketing alignment.
If you are running affiliate traffic, buying clicks, or scaling lead gen offers, that gap matters more than most people admit. While your lead conversion rate tells you how many people opt in, it only provides part of the story.
The real challenge lies in the gap between those initial opt-ins and the final revenue generated within your affiliate sales funnel.
Plenty of campaigns look good on the front end but fall apart once you verify what happens after the opt-in occurs. That is why the lead to sale rate is one of the most important metrics to monitor.
When you can track it accurately, you stop guessing which offers, sources, and creatives are actually driving profit.
Key Takeaways On The Lead To Sale Rate
- Lead-to-sale rate reveals true profitability: Unlike simple lead counts, this metric exposes the actual value of your traffic by showing which leads successfully convert into revenue.
- Protect your tracking IDs: The integrity of your data depends on the click ID surviving the transition from your tracker through the advertiser’s funnel; if the thread breaks, your analytics become guesswork.
- Filter for quality: Always differentiate between raw leads, valid leads, and sales to avoid skewed performance data caused by scrubbed or low-quality entries.
- Embrace manual reconciliation: When advertiser visibility is limited, using a spreadsheet to match unique IDs across reports is the most reliable way to bridge the gap between clicks and sales.
- Respect the sales cycle: Account for the time lag between lead capture and sale completion, as expecting immediate conversions can lead to prematurely cutting off profitable campaigns.
What the lead-to-sale rate actually tells you
In plain English, this metric shows how many leads turn into actual sales. To calculate this metric, you can apply a standard conversion rate formula:
Lead-to-sale rate = Sales / Leads x 100
That number is different from your click-to-sale rate. It also tells a different story than your lead rate. If 1,000 clicks produce 120 leads and 24 sales, here is what that means:
- Lead rate = 120 / 1,000 x 100 = 12%
- Lead-to-sale rate = 24 / 120 x 100 = 20%
- Sales conversion rate = 24 / 1,000 x 100 = 2.4%

Same campaign, three different views.
That matters because you can buy traffic that generates cheap leads and still lose money if those leads do not close. On the flip side, a traffic source with a higher cost per lead can still win if those leads buy at a better rate.
If you want a quick refresher on standard affiliate conversion math, ThriveCart’s conversion-rate breakdown keeps the basic formulas easy to follow.
One more thing. Don’t lump all leads together if the advertiser scrubs them. Track raw leads, valid leads, and sales as separate counts. Because lead quality varies, filtering invalid entries is essential for understanding your true lead-to-customer conversion.
If 120 raw leads become 100 valid leads and then 24 sales, your raw lead-to-sale rate is 20%, but your valid lead-to-sale rate is 24%. That is a significant difference.
When numbers get messy later, this is usually where the mess started.
How to track it when you can see the sale data
The cleanest setup is simple on paper. Every click gets a unique ID. That same ID follows the user into the lead form, the advertiser, and the sale event.
That unique ID might be called a click ID, transaction ID, or something similar inside your tracker. Alongside it, you can pass sub IDs for source, campaign, ad, placement, keyword, or email drop. Those extra fields tell you where the lead came from, while the click ID tells you which exact click created the lead and sale.
A clean tracking setup beats a fancy dashboard every time.
Effective sales analytics depend on this level of precision.
Here is the usual flow. The user clicks your tracking link, and your tracker records the click to assign the click ID. That ID must be passed to the landing page and stored in hidden form fields or first-party cookies to ensure the value proposition stays consistent as the user moves through the buyer journey.
When the lead submits, a pixel or server event records the lead. Then, the advertiser or their CRM software sends a sale event back with that same click ID attached.
For front-end lead events, browser pixels can work. For downstream sales, server-to-server postbacks are usually stronger. Browsers block things, cookies expire, and people switch devices. A postback from the advertiser or CRM back to your tracker removes a lot of that noise.
If you are sorting out platforms, these best affiliate link tracking software options show the difference between simple click trackers and fuller attribution systems.
The important part is not the tool name. It is the handoff. If the click ID does not survive the jump into the advertiser systems, you lose the thread.
If the click ID breaks at any step, your sales report turns into educated guessing.
Also ask one blunt question up front: what counts as a sale? Is it the first order, a paid order, an approved order, or a net sale after refunds? If you and the advertiser use different definitions, your spreadsheet will lie to you with a straight face.
What to do when the advertiser hides part of the picture
This is where a lot of affiliates get stuck. The advertiser gives you leads, maybe a payout report, but not full downstream visibility. You are not blind, but you do need a backup plan to bridge the gap between raw clicks and qualified leads.
Start by passing every ID you can control. That means your click ID, sub IDs, and any network lead ID. If the advertiser won’t post back live sales, ask for a daily or weekly export with lead ID, status, sale date, and payout. Even a simple CSV can save the day if the IDs line up.
A CRM handoff helps here. If the advertiser uses a CRM, they can often store your external click ID in a custom field, then export it later when a lead becomes a customer. You may not get every order detail, but you can still tie the sale back to the original click.
This is essential for effective pipeline management, especially when you are performing reconciliation manually to determine which of your prospects are marketing qualified leads versus those that have become sales qualified leads.
When visibility is limited, manual reconciliation becomes part of the job.
Pull one report from your tracker with clicks and leads. Pull another from the advertiser or network with lead IDs and sale statuses. Match them in a spreadsheet using click ID, lead ID, or another stable identifier. It is not glamorous, but it works.
Outside affiliate traffic, the same logic shows up in lead conversion metrics used by sales teams. The label changes, but the problem does not.
If the advertiser only shares aggregate sales by day, you can still estimate by traffic source or campaign, but you need discipline. Keep attribution windows consistent. Separate click date, lead date, and sale date. A lead captured on Monday may not close until next week, and that is normal on many offers.
A sample tracking workflow you can copy
You don’t need a giant tech stack to make this work. You need one reliable workflow and the discipline to keep it intact to optimize your overall sales performance.
- Create a tracking link that appends source, campaign, ad, and placement into sub IDs.
- Send traffic through a tracker that generates a unique click ID for every visit.
- Pass that click ID into the opt-in form using hidden fields.
- Fire a lead event when the form submits, either by pixel, webhook, or direct tracker event.
- Send the lead into the advertiser or CRM with your click ID attached.
- Capture the sale with a postback or import a sales export and match it back to the original click.
That is the skeleton. Now, put some numbers on it. Say a solo ad sends 800 clicks. You generate 72 leads. Ten days later, 18 of those leads buy.
- Your lead rate is 9 percent.
- Your lead-to-sale rate is 25 percent.
- Your click-to-sale rate is 2.25 percent.
This tells you more than a cheap cost-per-lead ever could.
It also lets you compare traffic sources in a way that provides accurate insights. Maybe native traffic gives you 150 leads at a 10 percent sale rate. Paid social gives you 100 leads at a 22 percent sale rate. The second source may be the better buy even if the leads cost more.
If you are building campaigns into a repeatable system, a step-by-step affiliate strategy guide becomes much more useful once your tracking is clean.
Keep one more habit. Save both the lead timestamp and the sale timestamp. That allows you to measure lag and optimize your speed to lead, which tracks how quickly a prospect engages with your funnel. Some offers close in hours, while others take a week or longer.
During this lag time, your lead nurturing strategy is vital for improving your lead-to-customer conversion. If you only look at same-day results, you will likely kill good traffic too early.
A simple spreadsheet for reporting
A spreadsheet remains one of the best sanity checks for affiliate tracking. By keeping your data organized, you can easily monitor your sales efficiency and identify which campaigns are driving the most value.
Use one row per day, per offer, per traffic source, or go tighter with one row per campaign. The exact layout matters less than consistency.
| Date | Offer | Source | Campaign | Clicks | Raw Leads | Valid Leads | Sales | Revenue | Lead Rate | Lead-to-Sale Rate | EPC | Notes |
|---|---|---|---|---|---|---|---|---|---|---|---|---|
| 6/10/2026 | Insurance Lead Gen | Meta | CBO-A1 | 1200 | 96 | 88 | 18 | 1260 | 8.0% | 20.5% | 1.05 | 8 leads scrubbed |
Use these formulas:
- Lead rate = Valid Leads / Clicks
- Lead-to-sale rate = Sales / Valid Leads
- EPC = Revenue / Clicks
- Revenue per lead = Revenue / Valid Leads
That sample row tells a solid story. Out of 1,200 clicks, 88 were valid leads and 18 became sales. So the valid lead-to-sale rate is 20.5%. Revenue per lead is $14.32. By comparing this figure to your customer acquisition cost, you can quickly determine if your traffic spend is sustainable. If your cost per valid lead is under that revenue per lead, you are in business. If it is over, you are buying trouble.
Tracking these metrics effectively is the key to long-term revenue growth. When you understand exactly how many valid leads turn into sales, you can optimize your funnel to improve overall performance.
Keep a second tab for reconciliation. Include click ID, lead ID, sale ID, status, payout, lead date, and sale date. When something looks off in the summary sheet, the detail tab is where you find the leak.
Why your numbers don’t match
It is perfectly normal for your numbers to show minor discrepancies from day to day. While you should expect slight variations, you must avoid sloppy data handling.
Here are the most common reasons your tracking data might not align:
- Time zones do not line up. Your tracker may roll over at midnight EST while the advertiser reports in PST.
- Delayed conversions occur frequently. Because of the sales cycle length, leads often close days or even weeks after the initial opt-in.
- Duplicate or scrubbed leads distort your conversion rate. You should track raw and valid leads separately to get an accurate view of performance.
- Attribution window differences are a standard part of digital sales analytics. One system might count a sale within 7 days, while another uses a 30-day window.
- Duplicate firing happens when a thank-you page reload triggers a pixel twice if the technical setup is weak.
If:
– your click count is higher than the network, check whether one platform counts all clicks while the other counts only unique clicks.
– your lead count is higher than the advertiser, verify your validation rules, bot filters, and required fields.
– your sales are lower than expected, confirm if the advertiser is reporting gross sales, approved sales, or paid sales.
– you are promoting an offer with a longer closing period, try comparing your results against industry B2B benchmarks to see if your conversion timeline falls within an acceptable range.
For a quick reminder that partner programs define conversions in different ways, this partner KPI overview is a useful gut check.
The fix is usually boring. Match your definitions, align your dates, and sync your IDs. Then, compare your data again.
Frequently Asked Questions About The Lead To Sale Rate
Why is my lead-to-sale rate lower than my lead rate?
It is common for the lead-to-sale rate to be lower because it represents a deeper stage of the funnel. While a lead rate only requires a user to provide contact information, a lead-to-sale rate requires that same user to complete a financial transaction, which is a much higher barrier to entry.
How do I handle leads that close weeks after the initial click?
To maintain accuracy, you must record both the lead date and the sale date separately. By keeping your attribution windows consistent and allowing for this natural lag, you avoid the mistake of killing high-performing traffic sources that simply have a longer sales cycle.
What should I do if the advertiser doesn’t provide granular data?
If you lack full downstream visibility, request regular exports—such as a CSV—containing lead IDs, statuses, and sale dates. You can then use these exports to perform manual reconciliation against your internal tracker data to identify which sources are actually driving conversions.
Why do my reported numbers often differ from the advertiser’s reports?
Discrepancies are usually caused by technical differences in how each system handles time zones, conversion attribution windows, or bot filtering. Always verify that both you and the advertiser are using the same definitions for what constitutes a “valid lead” or a “completed sale” to ensure your spreadsheets align.
Final Thoughts On The Lead To Sale Rate
The lead to sale rate is where traffic quality, offer quality, and follow-up all meet. That is why it reveals the truth faster than raw lead count.
Protect the click ID, separate raw leads from valid leads, and keep sale dates tied back to the original source. When you do that, your reporting becomes data driven rather than emotional. By implementing a consistent conversion strategy, you can rely on actual performance metrics to guide your decisions.
Once your tracking is accurate, you can further optimize your lead to sale rate results by integrating personalization and social proof into your follow up sequences. When you can trace a sale back to the click that started it, scaling stops feeling like a gamble.