Malcolm Keith 2026
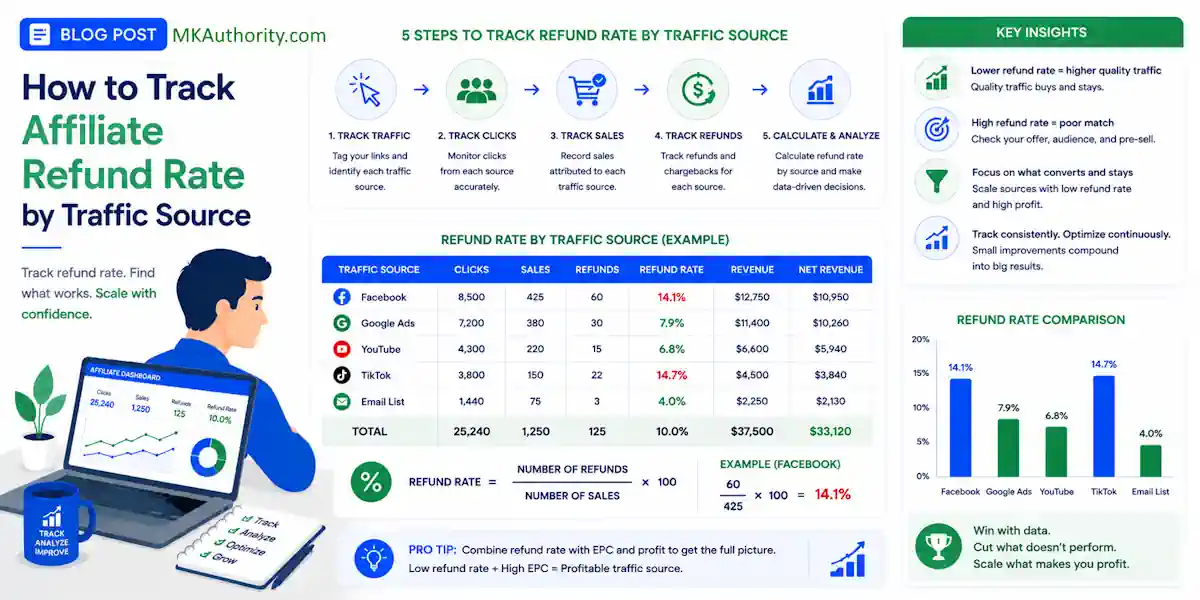
Gross commissions can be deceptive. A traffic source might look excellent on day 7, but it can quickly turn unprofitable once refunds start rolling in and your affiliate refund rate starts rising. Mastering your data is essential for long-term success in affiliate marketing because you need to understand the true value of your traffic beyond simple vanity metrics.
An affiliate refund rate is the percentage of affiliate-referred sales that are cancelled or returned by customers, resulting in the affiliate forfeiting their commission or the merchant reversing the payout.
If you only watch clicks, leads, and front-end sales, you are missing the metric that determines your actual profit. Monitoring your affiliate refund rate is the most vital step for managing any affiliate program you promote, as it reveals which clicks turn into kept commissions rather than temporary wins.
Most affiliate platforms do not hand you this specific report automatically.
Instead, you have to build it using the data you already have.
Key Takeaways When Looking At An Affiliate Refund Rate
- Move beyond gross commissions: Relying on gross sales numbers hides the true profitability of your campaigns, as high-volume sources often carry high refund rates that erode net revenue.
- Use sale-date cohorts: Never judge traffic quality based on the date a refund occurs; instead, group performance by the original sale date to ensure you are analyzing matured data.
- Implement precise tracking: Connect your clicks to conversions using unique identifiers like SubIDs or click IDs to ensure you can attribute specific refunds back to the original ad, keyword, or landing page.
- Calculate net performance: Always track and compare order-based and commission-based refund rates side-by-side to determine which traffic sources provide the highest net value after all reversals.
Why refund rate by source changes the whole picture
Not all traffic buys the same way. Some visitors arrive curious and ready. Others buy on impulse, hit the members area once, then ask for their money back.
That difference matters more than most affiliates admit. A source with the highest sales volume can still be your weakest source after refunds. A slower source with fewer sales can quietly beat it on net revenue. Whether you are working with a revenue share model that compounds over time or a flat CPA commission for every sale, a high refund rate can quickly destroy your profit margins.
Think about three common channels: paid social, search, and email. They do not bring the same level of intent. Broad social traffic often buys colder. Search traffic can convert with better intent. Email traffic may refund less if the list trusts you. That is why broad overviews of affiliate traffic sources are useful, but the real answer is always in your own numbers.
Your first job is to stop judging traffic by gross commission alone.
Use these three numbers side by side:
- Gross commission
- Refunded commission
- Net commission
Net commission is simple:
Net commission = Gross commission – Refunded commission
If Source A makes $4,000 and refunds $1,000, you did not make $4,000. You made $3,000 before ad costs. That sounds obvious, but a lot of campaign decisions still get made on the wrong column.
Refunds are where sloppy tracking gets exposed. If you cannot see which source created the refunded order, you cannot tell whether the problem is the traffic, the landing page, the ad angle, or the offer itself.
That is why serious affiliates track source level quality, not only source level volume.
Build the data trail before you trust the math
Most affiliate networks can show sales and reversals. Many cannot break refunds down cleanly by ad, keyword, landing page, or creative. So you need one thing that ties the click to the sale: a tracking ID.
That ID might be called a subID, click ID, transaction ID, tid, sid, or something similar. The name does not matter. The match does.
UTMs help on the traffic side. SubIDs help on the affiliate side. Put both to work. When building your tracking stack, robust affiliate software acts as the glue that connects these data points. Keep in mind that every affiliate program has a unique refund policy that dictates how long a sale remains eligible for a reversal. Remember that this data originates from the payment processor before it is reported by the network.
A lean setup might look like this: your ad uses UTMs, your tracker or landing page stores those values, and your outbound affiliate link passes a unique subID. When a sale happens, the network records that subID. When a refund happens, that same sale record gets reversed later.
These are the core fields worth capturing:
| Field | Comes from | Why you need it |
|---|---|---|
| Click ID or subID | Tracker or affiliate link | Ties the sale back to the original click |
| utm_source | Ad or email link | Groups performance by source |
| utm_campaign | Ad platform | Separates campaigns inside a source |
| Sale ID | Affiliate network | Stops duplicate counting |
| Sale date | Affiliate network | Sets the acquisition cohort |
| Refund date | Affiliate network | Shows when the reversal happened |
| Commission amount | Affiliate network | Calculates gross, refunded, and net |
If you are comparing tracking tools for affiliate campaigns, this is the feature that matters most: can the tool keep a clean path from click to conversion data?
For a simple setup, Google Sheets or Excel is enough. For bigger spend, affiliates often use ClickMagick, Voluum, RedTrack, or BeMob for click tracking, then move reporting into Looker Studio, Power BI, Airtable, or BigQuery. Network-side systems like Everflow, CAKE, Trackier, Trackdesk, or platforms like ClickBank can also help when you have access to richer transaction exports.
No matter what stack you use, bad naming will wreck it. FB, Facebook, Meta Ads, and paid-social should not all mean the same thing in four different files.
How to calculate affiliate refund rate without fooling yourself
There are two useful ways to measure refund rate, and you should track both.
Refund rate by order count shows how many sales reversed.
Refund rate by commission shows how much money reversed.
Here are the formulas:
- Refund rate by orders = Refunded orders / Total orders
- Refund rate by commission = Refunded commission / Gross commission
- Net EPC = Net commission / Clicks
Now put that into a real example.
Source A sends 1,200 clicks, 80 sales, and $3,200 in gross commission. Later, 12 of those sales refund, and $720 gets reversed.
Source B sends 900 clicks, 50 sales, and $2,000 in gross commission. Later, 3 sales refund, and $180 gets reversed.
Here is what the two sources look like:
- Source A order refund rate = 12 / 80 = 15%
- Source A commission refund rate = 720 / 3200 = 22.5%
- Source B order refund rate = 3 / 50 = 6%
- Source B commission refund rate = 180 / 2000 = 9%
At first glance, Source A looks like the winner. However, after accounting for the commission decline caused by these reversals, the story changes. If ad spend is similar, Source B may be the better business. When calculating your final profit, remember that any negative commission appearing in your dashboard represents a direct loss that you must attribute back to the original traffic source. You should also compare these results against the benchmark vendor refund rate to see if your specific traffic quality is higher or lower than the program average.
Now the part most reports get wrong: sale date versus refund date.
If a customer buys on May 28 and refunds on June 20, the refund belongs to the May traffic cohort when you are judging source quality. It does not belong to June acquisition performance. A refund posted this month often came from clicks bought last month.
If an offer has a 60-day refund policy, a 14-day traffic report is a draft, not a verdict.

Use sale-date cohorts for performance decisions. That means you group orders by the original sale date and traffic source, then watch what portion of that cohort refunds over the full window.
Keep a separate cash flow report by refund date if you want to see money leaving the account this week. That is useful too. It just answers a different question.
A good cohort report has one status label: open or matured.
If the refund window is 30 days, do not finalize the cohort until day 31.
If the offer allows 60 days, wait 60 days.
Otherwise, you are grading half-finished data.
A simple workflow with subIDs, UTMs, spreadsheets, or BI
You don’t need an enterprise stack to do this well. You need a repeatable workflow.
- Tag every click. Add UTMs to the traffic URL. Pass a unique subID or click ID into the affiliate link. If you’re testing page variants, use a separate subID for each version. This pairs nicely with an affiliate split testing guide because page tests often change refund behavior, not only conversion rate.
- Export two files on a schedule. Pull click data from your tracker, ad platform, or analytics setup. Pull sales and refunds from the affiliate network. Remember to account for the typical refund processing time of your offer, as data is often incomplete during the initial window. Weekly works for small volume, but daily is better once spend climbs.
- Normalize the naming. Map “Meta”, “Facebook Ads”, and “FB” into one source value. Do the same for campaigns, offers, and landing pages. This step sounds boring because it is, but it saves hours later.
- Join the data. In Sheets or Excel, use XLOOKUP, INDEX/MATCH, or Power Query to match sale records to click IDs. In BI tools, join tables on subID, click ID, or sale ID. Keep in mind that networks use action locking periods before commissions are finalized; your reporting must correctly account for any action reversals that occur during these cycles. GA4 can help with top-of-funnel behavior, but it usually won’t solve affiliate refund attribution on its own unless you can import the conversion and refund events back in.
- Report matured cohorts. Show clicks, sales, gross commission, refunded commission, net commission, order refund rate, commission refund rate, and net EPC by source.
Once you have those fields, you can go one step further and calculate refund-adjusted ROI.
That’s when source quality becomes impossible to ignore.
The dashboard doesn’t need to look fancy.
It needs to answer one clean question: which source keeps the most commission after the refund window closes?
Quick checklist and the mistakes that throw everything off
Use this checklist to ensure accuracy before you trust any performance report:
- Every outbound affiliate click includes a unique subID or click ID.
- Traffic links utilize consistent UTM naming conventions.
- Sale dates and refund dates are stored in separate columns.
- Sale IDs are properly de-duplicated.
- Every partial refund and individual chargeback is captured in your data.
- You account for customer returns, which serve as the physical equivalent of these digital reversals.
- Data cohorts remain open until the specified hold period concludes.
- Every commission adjustment is reflected in your final payout calculations.
- Gross and net commission are displayed side by side.

The biggest mistake is mixing refund-date reporting with sale-date performance analysis. That approach turns May problems into June problems and directs your optimization efforts toward the wrong traffic source.
Another common miss is stopping your analysis at the broad source level. If one Facebook campaign has a 7% refund rate and another has 24%, “Facebook” is too broad to fix the underlying issue. You must break performance down by specific campaign, ad angle, landing page, and even device.
One more thing, do not judge traffic quality by conversion rate alone. Source-level economics can swing hard, and affiliate ROI can vary by channel even before refunds enter the picture.
Frequently Asked Questions About An Affiliate Refund Rate
Why does my traffic source report change after a few weeks?
Traffic reports change because affiliate offers have refund windows that can last 30 to 60 days. A sale that looks profitable on day 7 may become a net loss if the customer requests a refund on day 45, which is why you must wait for cohorts to mature before drawing conclusions.
Can I use Google Analytics to track affiliate refunds?
Google Analytics 4 is excellent for top-of-funnel behavior, but it typically lacks the native integration to track individual affiliate sale reversals automatically. You will generally need to export transaction data from your affiliate network and join it with your click data in a spreadsheet or BI tool to get an accurate picture.
How do I handle refunds when calculating ROI?
To get an accurate ROI, you must calculate your profit using your net commission rather than your gross commission. By subtracting the refunded amount from the total revenue earned from a specific source, you ensure your ROI reflects the actual cash kept after the refund window has closed.
What is the most common mistake when tracking affiliate refund rates?
The biggest mistake is mixing refund-date reporting with sale-date performance analysis. If you attribute a refund to the current month instead of the month the original sale occurred, you will misjudge the quality of your current traffic and incorrectly optimize your active campaigns.
Conclusion When Looking At An Affiliate Refund Rate
The traffic source with the prettiest gross numbers is not always the one paying you 30 or 60 days later. Refunds tell the truth faster than hype does. Whether you are promoting offers on ClickBank or managing campaigns through a private network, your affiliate refund rate serves as the ultimate truth-teller for your traffic quality.
Track the click with subIDs, keep UTMs clean, and judge results on matured cohorts tied to the original sale date. When you do that, your affiliate refund rate stops being a blind spot and starts becoming one of the best filters in your business.