Malcolm Keith 2026
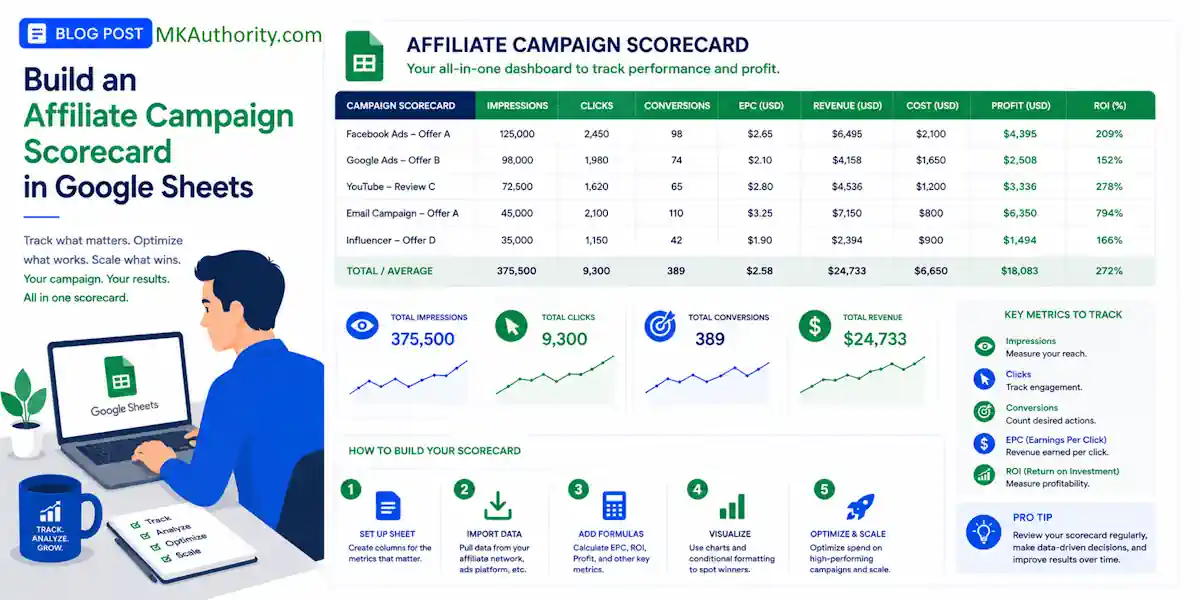
Most affiliate campaigns do not fail because the offer is bad. They fail because the tracking is messy, and the budget keeps flowing to the wrong traffic. When you lack a clear method for tracking marketing performance, it becomes nearly impossible to make data-driven decisions. A solid affiliate campaign scorecard fixes that.
You stop staring at scattered numbers and start seeing which campaigns earn, which ones stall, and which ones need to be cut. If your current sheet is more of a storage bin than a decision tool, this setup will help you build an effective affiliate campaign scorecard to clean it up fast.
Key Takeaways On An Affiliate Campaign Scorecard
- Move beyond vanity metrics: Stop focusing on raw volume and start measuring performance through essential KPIs like conversion rate, EPC, and ROI to identify true campaign success.
- Normalize for accuracy: Because metrics like ROI and conversion rate operate on different scales, use min-max normalization to weigh them fairly against each other.
- Implement a weighted scoring system: Assign business-specific weights to your KPIs to ensure your final score reflects your actual bottom-line goals, such as prioritizing profit over pure traffic volume.
- Use visual indicators: Apply conditional formatting and automated status labels to highlight top performers and catch budget-draining campaigns at a glance.
What a scorecard should tell you at a glance

A good scorecard is not a giant data dump. It is a ranking system designed to provide clarity.
When you open the sheet, you should be able to answer three questions in under a minute.
Which campaign is profitable?
Maybe a campaign has promise but needs work?
Which one is burning clicks with no return?
That means raw metrics alone are not enough. While many marketers obsess over vanity metrics like total click volume, these numbers do not tell the whole story. Instead, you need to focus on essential affiliate marketing kpis.
A campaign with 500 clicks can still be worse than one with 90 clicks if the smaller campaign has better EPC, better ROI, and stronger lead quality.
Think of it like a report card. A student does not get graded on attendance alone, and campaigns should not be judged on volume alone. By moving beyond raw numbers, you can effectively evaluate partner performance and transform your spreadsheet into a comprehensive marketing funnel scorecard.
The base inputs belong in the sheet: clicks, conversions, revenue, commission, and spend. Your final score comes from the performance metrics built on top of those inputs, usually conversion rate, EPC, ROI, and a quality score.
If the sheet cannot rank campaigns fast, it is not a scorecard yet.
One more thing: compare like with like. Cold traffic, retargeting traffic, email traffic, and content traffic often behave differently. Score them together only if the goal and traffic intent are close enough to make the comparison fair.
Set up your Google Sheets layout first
Keep the layout simple to ensure your scorecard template remains functional and easy to read. Organizing your data with one row per campaign for a specific date range works best, whether you are tracking daily, weekly, or monthly performance for your affiliate partner program.
Use this column structure as your starting point:
| Column | What goes here |
|---|---|
| A | Date |
| B | Campaign |
| C | Traffic Source |
| D | Offer |
| E | Spend |
| F | Clicks |
| G | Conversions |
| H | Revenue |
| I | Commission |
| J | Conversion Rate |
| K | EPC |
| L | ROI |
| M | Customer Acquisition Cost |
| N | Quality Score |
| O | CR Score |
| P | EPC Score |
| Q | ROI Score |
| R | Quality Score Normalized |
| S | Overall Score |
| T | Status |
By including the customer acquisition cost in your layout, you get a clearer picture of your profitability alongside your raw numbers, calculated KPIs, and the final scorecard output.
A few setup tips make the sheet easier to manage long term. Freeze row 1, turn on filters, and format spend, revenue, commission, EPC, and customer acquisition cost as currency. Format conversion rate and ROI as percentages. Keep your quality score as a simple number ranging from 1 to 10.
The quality score serves as the human check that raw numbers often miss. You can rate traffic based on lead quality, refund rates, adherence to compliance standards, conversion lag, or how well the audience matches the offer. If a campaign looks profitable on paper but sends low-value traffic, the quality score keeps your scorecard honest.
If you want extra spreadsheet shortcuts, Google Sheet tips for affiliate marketers has a few useful ideas you can borrow.
Add the formulas to calculate your affiliate marketing KPIs
Now the sheet starts doing real work. By setting up these calculations, you can transform raw data into actionable insights.
In row 2, add your formulas for the core metrics. Assuming spend is in E, clicks in F, conversions in G, and commission in I, use these:
- Conversion rate in J2:
=IFERROR(G2/F2,0) - EPC in K2:
=IFERROR(I2/F2,0) - ROI in L2:
=IFERROR((I2-E2)/E2,0)
These formulas are simple on purpose. They help you evaluate how well the campaign converts, how much each click is worth, and whether your roi measurement indicates that the campaign generates a positive return on ad spend.
Use revenue in column H if you want to track total sales value from the offer. Use commission in column I for what you actually earn. For most affiliate managers, commission is the cleaner number for calculating EPC and ROI.
Normalize the scoring metrics
Here is the catch. Conversion rate, EPC, ROI, and quality score all live on different scales. You cannot add them together raw and expect a fair result.
Normalization solves that problem, which is essential for accurate affiliate activity tracking across different campaigns. It converts each metric to a 0 to 1 score, allowing you to weigh disparate data points equally. For:
– conversion rate in N2, use min-max normalization:
=IFERROR((J2-MIN($J$2:$J$1000))/(MAX($J$2:$J$1000)-MIN($J$2:$J$1000)),0)
– EPC in O2:
=IFERROR((K2-MIN($K$2:$K$1000))/(MAX($K$2:$K$1000)-MIN($K$2:$K$1000)),0)
– ROI in P2:
=IFERROR((L2-MIN($L$2:$L$1000))/(MAX($L$2:$L$1000)-MIN($L$2:$L$1000)),0)
If your quality score runs from 1 to 10, you do not need min-max normalization for that one. Keep it simple in Q2:
=IFERROR(M2/10,0)
Copy the formulas down the sheet. Once they are in place, every campaign gets an apples-to-apples score for each KPI.
Normalize campaigns within the same date range and traffic type. A warm retargeting ad should not compete with a fresh cold traffic test when you are evaluating performance.
If you want a visual reference for a simple tracking template, this affiliate checklist video walkthrough can help spark ideas for your own dashboard.
Assign weights and calculate the overall campaign score
Not every metric deserves equal influence. When you build your scorecard, you are essentially defining the business outcomes that matter most to your bottom line.
If you are buying traffic, ROI usually matters more than raw conversion rate. If you are testing multiple landing pages for the same offer, EPC may deserve more weight. By customizing these values, you can make data-driven decisions that align perfectly with your strategy.
Put your weights off to the side so you can edit them without touching formulas. For example, use cells U1 through X2 like this:
| Metric | Weight |
|---|---|
| CR Score | 0.25 |
| EPC Score | 0.25 |
| ROI Score | 0.35 |
| Quality Score | 0.15 |
These weights add up to 1.00. That matters.
In R2, calculate the final score with SUMPRODUCT:
=ROUND(SUMPRODUCT(N2:Q2,$U$2:$X$2)*100,1)
That gives you a score out of 100. A campaign with strong ROI, solid EPC, and high quality will allow the best partner performance to rise to the top, even if the click volume is modest.
Then add a status label in S2:
=IF(R2>=75,"Top",IF(R2>=50,"Watch","Underperforming"))
This is where the sheet becomes useful in real life. You can sort by overall score, filter by traffic source, and spot winners without digging through every metric one by one.
Don’t get cute with too many weighted inputs at first. Four scoring metrics is enough for most affiliate setups. Once the sheet proves itself, you can add more complex variables like refund rate, approval rate, or average order value.
If your network or tracking platform supports automation, automated reporting tools such as Trackdesk’s Google Sheets integration can push conversion rows into a live sheet and save you from manual exports.
Highlight top campaigns and catch underperformers early
A good score is helpful. A score that jumps off the screen is better.
Use conditional formatting on the Overall Score column to create a real-time action tracker for your marketing activities. Set one rule for green when the score is 75 or higher, one for yellow between 50 and 74.9, and one for red below 50. In a busy account, color does the heavy lifting, allowing you to scan your dashboard and identify priority areas instantly.
You can go one step further and flag obvious problems. For example, if a campaign has enough clicks to judge but still no conversions, give yourself a warning. In T2, you could use:
=IF(AND(F2>=100,G2=0),"Needs review","")
That catches the classic budget leak, where traffic is flowing but nothing happens, and nobody notices until the spend report lands.
You should also sort or filter the sheet by source. Facebook, solo ads, YouTube, native, and search traffic often require unique benchmarks. A 2 percent conversion rate might look weak in one channel and perfectly fine in another. This process is essential for effective conversion rate optimization, as it helps you distinguish between low-performing assets and channels that simply function differently. You can also use these channel-specific benchmarks to better compare your performance against industry peers or your own internal standards.
Review the scorecard on a fixed schedule. Daily works best for paid traffic with significant spend behind it. Weekly is fine for slower-moving content campaigns. The habit matters more than the fancy math.
And keep one rule in place: if the score says top but your gut says the traffic quality is off, trust the follow-up check. Numbers guide the decision, but they do not replace your human judgment.
Frequently Asked Questions About An Affiliate Campaign Scorecard
Why should I use a quality score instead of just relying on financial data?
Financial data only tells you if a campaign is profitable right now, but it can hide underlying issues like high refund rates or low-value leads. A quality score acts as a human check, allowing you to manually account for factors that raw numbers miss, such as compliance or lead quality.
How often should I update and review my affiliate scorecard?
For paid traffic campaigns with significant spend, you should review your scorecard daily to prevent budget leaks. If you are managing slower-moving organic or content-based campaigns, a weekly review is generally sufficient to make informed decisions.
Can I compare different traffic sources in the same scorecard?
It is best to compare like with like, as cold traffic, retargeting, and email traffic often have drastically different performance benchmarks. Only score them together if the goal and intent of the traffic are similar enough to make a fair comparison.
What do I do if my scorecard says a campaign is performing well, but I suspect otherwise?
Always trust your intuition when it conflicts with the data. While your scorecard is designed to guide your decisions, it is a tool for support, not a replacement for your human experience and oversight of the campaign.
Conclusion On Building an Affiliate Campaign Scorecard in Google Sheets
A spreadsheet stops being clutter the moment it tells you where your budget should go next. That is the fundamental value of an affiliate campaign scorecard. By utilizing a marketing funnel scorecard methodology, you gain the clarity needed to recruit new partners based on proven, objective data rather than guesswork.

Track your raw numbers, normalize the right KPIs, apply weights that align with your goals, and let the final score rank your performance. Once this system is active, you can scale winners and cut weak campaigns with total confidence.
As your operations mature, you can incorporate advanced metrics like revenue per active partner or integrate data from your lead generation platform to refine your strategy.
Building a sustainable affiliate partner program is about more than just immediate conversion data. Over time, you should aim to measure long term indicators such as incrementals, customer lifetime value, and brand reputation. Build your first version,of your affiliate campaign scorecard, use it for a week, and adjust your weights only after the data gives you a clear reason to do so.

See also:
CPM vs CPC vs CPA for New Affiliates