 Malcolm Keith 2026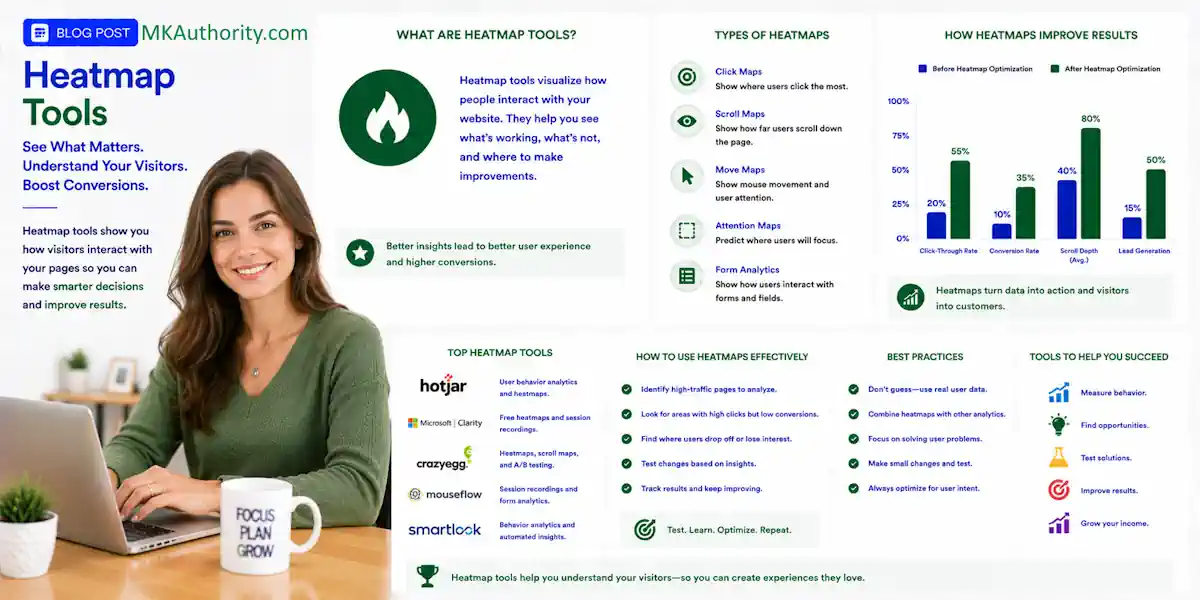

Not every red patch on attention heatmaps earns you a commission. Website heatmap tools are visual analytics software that use color-coded overlays to show where users click, tap, move their mouse or scroll on a web page. Paid clicks can look busy while people skip your form, tap dead text, and leave before seeing the offer.
Heatmap tools show user behavior through clicks, hesitation, scrolling, and abandonment on your affiliate page. That gives you useful clues before you spend more money fixing the page by guesswork.
Use focused digital experience analytics for your affiliate page. Then connect those signals to tracker clicks, leads, and cleared commissions.
Key Takeaways About Heatmap Tools
- Heatmaps reveal clicks, scroll depth, dead clicks, rage clicks, and page friction, but they do not prove affiliate sales or track literal eye movements.
- Microsoft Clarity is a strong free starting point for basic landing pages, while tools such as Hotjar, Cra.zy Egg, Mouseflow, Lucky Orange, VWO Insights, FullStory, and Contentsquare add deeper analysis.
- Dynamic pages, quizzes, popups, and multi-step forms need state-aware tracking because static URL reports can blend different page experiences together.
- Connect heatmap activity to tracker clicks, unique sub IDs, network postbacks, and cleared commissions. Affiliate-network reporting remains the source of truth for off-domain sales.
- Run focused seven-day tests, change one variable at a time, protect visitor privacy, and judge the page by EPC and cleared money rather than attractive click patterns alone.
What Heatmap Tools Show on an Affiliate Page
Heatmaps use color to show aggregated activity. Attention heatmaps use warm colors for more interaction and cool areas for less attention, but they don’t track literal eye movements. This view of user behavior sounds basic, but it can expose a big problem fast.
Click Maps Reveal CTA Problems
Click maps tell you where visitors expect something to happen. If people repeatedly click an unlinked image, headline, testimonial, or comparison box, you’ve found dead clicks. Misleading visual affordances create friction in the user experience.
On a bridge page, your job is to move qualified visitors toward one next action. That might be an opt-in, quiz, webinar registration, or affiliate link.
Look closely at:
- Clicks on your main CTA button versus other page elements.
- Dead clicks on text, logos, images, and fake-looking buttons.
- Whether visitors choose the affiliate link before reading the proof.
- Which CTA gets attention on mobile compared with desktop.
- Rage clicks, or repeated frustrated clicks, near the CTA or form. They can signal friction, but they don’t prove intent.
A heatmap can show interest. It cannot tell you whether the affiliate network credited the sale.
Scroll Maps Show Where Your Message Loses People
Scroll maps show how far people get down the page, revealing their scroll depth before they leave. If most visitors never reach your testimonial block or second CTA, the answer isn’t always “add more copy.” You may need to move your strongest proof higher up.

A heatmap summarizes quantitative behavior across many visits, while session recordings show an individual visit. Session recordings add the human side of the story. A session replay lets you watch user behavior as one visitor struggles with a form, bounces between sections, or leaves after a popup appears.
Cursor movement is only a rough attention signal. It is not the same thing as eye tracking.
Together, maps and recordings make behavior analytics more useful for diagnosing page friction. This combination supports digital experience analytics by connecting broad patterns with individual struggles.
Best Heatmap Tools for Affiliate Landing Pages
Price matters when you are still testing offers and traffic sources for conversion rate optimization. A $100 monthly analytics stack makes no sense when testing volume is low and your campaign has not produced a single cleared commission.
Microsoft Clarity Is the Solid Free Starting Point
Microsoft Clarity remains the obvious first stop for many affiliate marketers because it is free forever. It includes native heatmaps, session recordings, click maps, and scroll maps. You can inspect CTA activity, scroll depth, rage clicks, and page friction without another monthly bill.
A Cra.zy Egg comparison with Microsoft Clarity also positions Clarity as the simple no-cost option for maps and recordings.
Clarity is great for a basic pre-sell page and simple user behavior checks. For deeper segmentation, choose a paid platform once testing volume supports it. It does not natively connect a click on your button to an affiliate payout. You still need tracking links, sub IDs, and postbacks for that part.
Paid Options Add More Ways to Diagnose Friction
These heatmap tools are worth comparing once you need deeper filters, feedback, funnel views, or more detailed reports. Contentsquare is an enterprise option for larger teams, but its scope may exceed a small affiliate test.
| Tool | Strong fit | Native behavior features | Public price signal |
|---|---|---|---|
| Hotjar | Feedback-led page testing | Hotjar heatmaps, recordings, feedback tools | Free tier, paid plans reported around $32 to $39 monthly |
| Cra.zy Egg | Visual page review | Heatmaps and recordings | Free plan available, paid tiers vary |
| Mouseflow | Replay and funnel review | Maps, recordings, funnels, form analysis | Free allowance reported, paid plans around $25 to $31 monthly |
| Lucky Orange | Visitor-level review | Maps and recordings | Free limits reported, paid plans around $32 to $39 monthly |
| Plerdy heatmaps | Budget-friendly page analysis | Click, scroll, and sequence maps | Free usage reported, paid plans from about $32 monthly |
| Contentsquare | Enterprise teams with larger datasets | Contentsquare page reports and journey views | Custom pricing |
One affiliate caveat: a platform built for on-site ecommerce analytics may not solve off-domain affiliate attribution.
Pricing, session limits, and packages can change. Contentsquare pricing is often custom, so compare its package limits with your traffic needs. A Hotjar, Cra.zy Egg, and Mouseflow feature comparison is useful for narrowing your shortlist, but always check the live plan before paying.
For a practical affiliate shortlist, start with Clarity for early tests. Add Contentsquare only when traffic and reporting needs justify enterprise pricing.

When Basic Heatmaps Are Not Enough
A one-page affiliate bridge page doesn’t need enterprise software. But basic heatmap tools can fail on quizzes, multi-step forms, and stateful pages.
These experiences change without a new URL. A static snapshot may miss what visitors see at each step.
Dynamic Pages Need Dynamic Tracking
Single Page Applications, popups, tabs, countdown timers, accordions, and quiz steps are dynamic elements that can confuse static reports. The URL may stay the same while states change, distorting the user experience and blending user behavior across screens.
Click maps and scroll maps may merge several states into one report. Forms, quizzes, and multi-step flows need element-aware reporting rather than a single URL snapshot.
Behavior analytics provides a broader diagnostic view when page state affects what visitors can do. Digital experience analytics can compare dynamic page states across enterprise sites and journeys. Contentsquare is built for larger sites that need zone-based analysis across many page sections.
Those comparisons work best when each state has a distinct event or zone label.
Contentsquare can compare zone-level engagement across alternative states. This helps separate a quiz step from the page around it.
Contentsquare can map journey paths across sections when state and zone labels are configured. Clear labels help analysts distinguish a quiz step from the page around it. Contentsquare can also group related events, helping teams compare interactions without relying on one URL.
At enterprise scale, digital experience analytics connects those states to broader journey analysis. For large sites, Contentsquare supports cross-section analysis that smaller tools may not handle well.
VWO Insights offers dynamic heatmaps, click-area reports, element lists, session recordings, funnels, form analytics, and surveys. Compared with static reports, its session recordings can reveal user behavior before and after a state change.
FullStory adds session replay and conversion funnels for session-level diagnosis. Also, FullStory preserves individual interaction detail, making state-specific review easier. FullStory can also diagnose funnel or journey friction at the interaction level.
Before you commit, test the tool on your actual page builder or framework, including its dynamic elements on the live page. A map that mixes three popup states together can send you in the wrong direction.
Revenue Maps Still Need Affiliate Attribution
Contentsquare offers revenue heatmaps for on-site revenue events. That’s useful ecommerce analytics for stores with checkout data on their own domain.
With configured event definitions, Contentsquare can connect those events to page zones. For affiliate marketers, the harder issue starts after the outbound click. Contentsquare can’t verify a merchant-side purchase when the transaction happens off-domain.
Your heatmap can confirm that someone clicked a CTA, but it can’t prove the merchant tracked your sale. Use affiliate conversion tracking basics to connect the page click, tracker ID, network postback, and commission report. Those downstream records remain the source of truth.
Turn Behavior Data Into Better Affiliate Page Decisions
Don’t change ten things because one set of click maps looks ugly. For conversion rate optimization, pick one question, change one variable, and don’t move on after one report.
Fix the Earliest Friction Point First
If user behavior shows paid social traffic leaving before the headline’s promise, the issue may be your ad-to-page message match. When people scroll but do not click, your CTA or offer angle may be weak. If they click but do not convert later, traffic quality or merchant-offer quality may be the problem.
Use user behavior to distinguish a message mismatch from weak CTA motivation or poor traffic quality. A Contentsquare zone report can help show where friction starts, near the promise, CTA, or offer details.
Start with one controlled change:
- Move the primary CTA above the point where most mobile visitors leave.
- Turn frequently clicked text or images into useful links.
- Remove a popup that interrupts the first 10 seconds.
- Put trust details beside the form instead of hiding them near the footer.
- Match the landing-page headline to the exact claim in the ad.
Digital experience analytics works best when behavior evidence guides a controlled page change, not when you rely on visual inspection alone. Use FullStory session replay when an individual visitor’s recording matters more than an aggregate map.
A high click-through rate can feel awesome. But a controversial ad that brings the wrong people is not a win.
Track Each Affiliate Link Separately
Give every important outbound CTA its own identifier. Your hero button, mid-page text link, review-table link, and final button should not all look the same inside your tracker.
Use page name, page version, traffic source, and CTA placement in your parameters. This affiliate sub ID tracking guide shows how to separate clicks by placement. Compare those placements through your conversion funnels instead of guessing which link produced the sale.
Check three numbers together: heatmap clicks, tracker clicks, and network-reported conversions. Even a detailed Contentsquare on-site report doesn’t replace affiliate-network reporting. If the counts do not line up, look for redirect issues, blocked scripts, broken parameters, or delayed reporting.
Privacy, Consent, Speed, and Data Accuracy
A behavior tool is not a free pass to collect all user behavior. GDPR, CCPA, CPRA, and other privacy rules depend on visitor location, consent, masking, and script configuration.
Treat Consent Settings as Part of Your Funnel
Use a consent platform when it applies to your audience, and configure your analytics tag around that choice. For session replay and form analytics, mask form fields and exclude sensitive pages. Never capture passwords, payment details, or private messages.
Some vendor pages discuss privacy controls, including a vendor comparison of Microsoft Clarity and Mouseflow. FullStory offers masking and exclusion controls, and Contentsquare lets teams configure privacy and masking controls. Your privacy notice, consent wording, retention settings, and setup are still your responsibility.
Don’t Let Bad Data Pick Your Winner
Consent loss, script blocking, and poor filtering can distort behavior analytics reports. Digital experience analytics has the same data-quality limits. Don’t import ecommerce analytics assumptions from checkout sites into affiliate-page reporting.
Behavior scripts usually load asynchronously, but they still add another request to the page. Test your page speed before and after installation, especially on a mobile connection.
Also use user segmentation in your reports. Separate user behavior by device, source, page version, and campaign. Click maps and scroll maps can reveal a poor mobile layout that a desktop view hides. In Contentsquare, filter reports by device, source, or page state, and exclude internal visits, bots, and team testing before making a major page decision.
Run a Seven-Day Test Before You Scale
Heatmaps work best when you already know what you are trying to improve.
For conversion rate optimization, define the question and baseline first. Over seven days, digital experience analytics can turn observed behavior into a practical decision.
Keep the Test Small and Controlled
For the first few days, send one traffic source to one version of the page. Do not mix five ads, three offers, and two page builders into the same test.
- Write down the main conversion action, your current baseline, and the user behavior you expect to measure.
- Tag every outbound CTA with a unique tracking value. If you use Contentsquare, make sure its tags separate this test from other campaigns.
- Collect enough relevant visits to spot repeated behavior, not just one strange session.
- Review scroll maps, click maps, scroll depth, and session recordings.
- Change one element, then compare the next relevant traffic batch through the same conversion funnels.
You are looking for repeated patterns, not perfection.
Use a session replay sample to check individual sessions, not just aggregate patterns. Teams using FullStory can add deeper replay and funnel views when a heatmap pattern needs validation.
Compare the next batch with the same page state and audience, using scroll maps to confirm the change altered behavior. In Contentsquare, apply the same traffic and page filters before comparing results.
Judge the Page by Cleared Money
Your financial ceiling starts with this formula:
Expected commission per click = sales conversion rate x commission per sale x (1 – refund and reversal reserve)
If an offer pays $35 per sale, your visitor-to-sale rate is 2%, and you hold back 20% for reversals, the expected value is $0.56 per click. That is not a safe bid. It is the rough ceiling before traffic costs, page software, email tools, and profit.
Track EPC, cost per lead, sales, refunds, and cleared commissions. A hot CTA map is encouraging. Cleared cash is what tells you if the campaign is working.
Frequently Asked Questions
What is the best free heatmap tool for an affiliate landing page?
Microsoft Clarity is a practical free starting point because it includes heatmaps, click maps, scroll maps, and session recordings. It works well for basic pre-sell pages, but it does not replace affiliate conversion tracking.
Can heatmap tools track affiliate sales?
No. A heatmap can show that a visitor clicked an affiliate CTA, but it cannot verify a merchant-side purchase on another domain. Use tracking links, sub IDs, postbacks, and network reports to confirm conversions and cleared commissions.
Are heatmaps accurate for quizzes and multi-step forms?
Basic URL-based heatmaps may combine several page states into one report when the URL does not change. Test dynamic elements on your live page and use event, zone, or state-aware reporting when each step needs separate analysis.
How should I use heatmaps to improve conversion rates?
Start with one question, identify the earliest repeated friction point, and change one element at a time. Compare heatmap behavior with tracker clicks, conversion funnels, and cleared commissions instead of relying on a single visual report.
Do heatmap tools create privacy or performance risks?
They can if consent, masking, exclusion, and script settings are handled poorly. Mask sensitive fields, avoid capturing passwords or payment details, follow applicable privacy rules, and test page speed after installation.
Final Thoughts On Heatmap Tools
The best heatmap tools are the ones that help you spot a real problem without draining your testing budget.
Start with microsoft clarity if you need free behavior data and session recordings. Choose fullstory when you need deeper individual-session inspection through session replay.
Useful user behavior evidence becomes actionable behavior analytics when it connects to a measured conversion path. For enterprise digital experience analytics and reporting, contentsquare is a strong option.
Even contentsquare can’t replace affiliate attribution. A red button can get lots of clicks. A well-tracked conversion path is what turns those clicks into a business.